Simulate and Test Chirped Radar
This file type includes high resolution graphics and schematics when applicable.
Radar technology now serves a broad range of applications well beyond military systems, including commercial, civil, and scientific uses. Radar is also being used in weather and law-enforcement applications, as well as in automotive and public transportation system, for global mapping, oil exploration, and even for quality control in manufacturing applications.
A number of different radar techniques have been developed to support these many applications areas, although the fundamental capability of a radar system to process reflected RF/microwave signal information and identify the location, speed, and direction of a target remains the primary purpose for modern radar systems.
Most radar systems operate by means of a pulsed RF/microwave signal directed towards an object of interest, collecting reflected energy from the target using the same antenna that transmitted the pulses. However, some radar systems achieve this measurement using frequency-stepped chirped radar (FSCR) signals to transmit pulsed signals that conform to linear frequency ramps (known as chirps). FSCR radar systems are noteworthy for their capabilities to achieve excellent radar resolution using limited instantaneous bandwidth.
In such systems, successive pulses increase linearly in discrete frequency steps and pulse-modulated signals are transmitted via antennas. The echo signal that is reflected back to the antenna is combined with the transmitted signal to create a beat signal to calculate round trip time, τ, which is inversely proportional to the bandwidth (BW).
A radar system’s range resolution is its capability to distinguish between two different targets at the same bearing with two different ranges.1 Denoting c as the speed of light, range resolution can be found from the following relationship:
Range resolution = c(1/2BW)
and
fn = f0 + nΔf
In performing calculations, the transmit frequency is stepped linearly from f0, the starting carrier frequency, while Δf represents the size of the frequency steps and n = 1…N where each burst equals N pulses.
Because the bandwidth is proportional to NΔf, the range resolution equation can be rewritten with the frequency steps taking the place of bandwidth in the denominator:
Range resolution = c(1/2NΔf)
A linear stepped frequency system covers a wide bandwidth by achieving NΔf with multiple pulses. This is a powerful and versatile radar approach since the range resolution can be improved by changing NΔf. The FSCR technique allows radar systems to achieve better range resolution with a design that implements a low instantaneous bandwidth and a relatively low sampling rate, ultimately lowering costs and reducing system complexity. Optimum design tools can yield a highly predictive design that facilitates hardware verification prior to amassing significant nonrecurring expenses and respin of custom microwave components.
The key functions of such a radar system can be modeled by means of modern computer-aided-engineering (CAE) systems simulation software using commercial off-the-shelf hardware as the radar system components. For example, by using high-frequency couplers, the same oscillator can serve as a stimulus for the mixer on the receiver as well as the transmitter. A commercial duplexer allows the radar system to transmit and receive in different time periods.
The radar receiver includes mixers, amplifiers, switches, isolators, phase detectors, analog-to-digital-converter (ADC) circuitry, and signal processors. Accurate timing, phase, and frequency measurements between transmit and receive signals enable the radar system to determine target range and velocity.
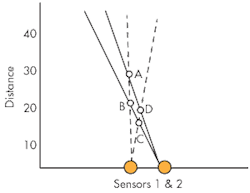
Because the radar’s target is mobile, the received signal will exhibit Doppler shifts. Differentiating between Doppler shift caused by clutter (objects that are not of interest but are returning reflected signals) and the true object of interest (the target) is a mathematically intensive problem. A moving target detection (MTD) caused by clutter can generate a false alarm. One way to mitigate this effect is to add additional sensors. A target’s position can then be obtained by triangulating the bearing measurements from each pair of sensors.2
Figure 1 shows a system with two sensors where the triangulation measurement yields four results (A, B, C, and D) for the two actual targets which would result in a false alarm. The number of false detections will increase as more targets are added. Also, a chirped radar system can create its own Doppler coupling effects.
An effective radar system model can serve as an invaluable tool when evaluating different radar applications. As an example, the Visual System Simulator (VSS) software from AWR Corp., a National Instruments company, features a number of useful tools built into the software, including a constant-false-alarm-rate (CFAR), MTD, and probability-of-detection (POD) indicators.
This type of signal processing is typically implemented by means of digital-signal-processing (DSP) circuitry within a receiver’s baseband section (and following RF/microwave signal detection). To facilitate analysis, the VSS software works seamlessly with the firm’s Microwave Office and Analog Office CAE software tools.
To build a representative model with such CAE software, the chirp signal as well as the quality of the receiver must be characterized to simulate real-world scenarios of multiple targets. By collecting echoes from chirped pulses and applying matched filtering and stochastic techniques, an image can be reconstructed with dimensional accuracy.
A host of computer-generated algorithms exist for radar signal processing to identify clutter and to reduce false alarms. Nevertheless, implementation of more-complex algorithms can be time consuming, especially when broadband coherent or correlated demodulation is required. Fortunately, FSCR systems can be modeled fairly easily using a broadband DSP-capable receiver.
To capture the frequency- and time-domain information for modeling radar signals, appropriate test equipment is required. A wideband vector signal analyzer (VSA), like the model NI-5668R from National Instruments, is one such example. This modular PXI-format analyzer, with available frequency ranges of 20 Hz to 14 GHz and 20 Hz to 26.5 GHz and as much as 765 MHz of instantaneous bandwidth, contains a powerful field-programmable gate array (FPGA) that can be used to simulate different radar detection algorithms.
Such advanced measurement hardware and modern CAE software tools provide the capabilities to dramatically improve the design efficiency, cost effectiveness, and performance of advanced radar architectures. The hardware and software tools make it possible to:
- Derive system constraints through a systematic budget analysis which accounts for system back-end processing, dynamic range, noise figure, and scan rate;
- Build a pulse Doppler radar model3 using empirical results and data files for subcomponents;
- Model subcomponents in the radar system using empirical results [an example will be shown for a key part of a radar-cross-section (RCS) model];
- Analyze system-level modeling data and optimize a radar system design to meet required specifications;
- Prototype a design using commercial products; and
- Extend the hardware system by adding receivers to simulate multiple sensors.
This file type includes high resolution graphics and schematics when applicable.
Delving Deep with VSS
This file type includes high resolution graphics and schematics when applicable.
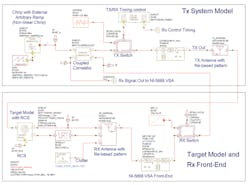
With a system-level software simulator such as VSS, a wide range of radar-system performance characteristics can be analyzed. As an example, Fig. 2 shows the model of a pulsed Doppler radar system with chirp capability. With VSS, the components of a basic radar architecture can be modeled using system-level primitive files, including actual or predicted S-parameter data files.
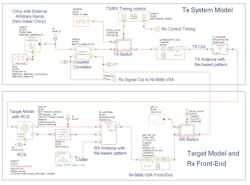
With such flexibility, a chirp generator can be specified using performance parameters while a radar antenna can be modeled using an actual radar-cross-section (RCS) pattern. After the chirped signal has been transmitted and reaches the target, the reflected signal is detected by the antenna and passed to the receiver.
Figure 3 shows the receiver block diagram for this analysis. The NI-5668R VSA incorporates a Kintex-7 FPGA from Xilinx. It can be programmed to model the receiver’s various matched filter responses to differentiate a signal of interest from clutter by applying advanced detection schemes.
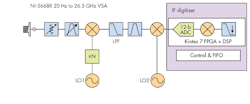
Figure 3 reveals the how various components within the NI-5668R VSR, such as a downconverter, software, firmware, and hardware, can be combined to model a basic radar system architecture. The final intermediate frequency (IF) in the system is digitized directly to avoid quadrature and offset errors common to zero-IF systems, thus avoiding calibration of in-phase/quadrature (I/Q) signal impairments.
The heart of the NI-5668R baseband processor is the Kintex-7 FPGA, which serves two purposes: It communicates directly with the host program, processing and controlling the flow of data over the bus to the host computer, and it also performs complex digital-signal-processing (DSP) algorithms on digitized baseband signals. The VSA’s instantaneous bandwidth of 765 MHz allows broadband microwave signals to be captured to 26.5 GHz by means of single data acquisitions. Capturing an entire wideband pulse in a single data acquisition helps to minimize spectral distortion.
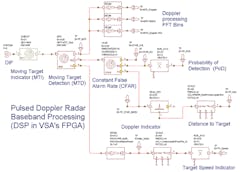
Figure 4 shows a signal processing chain for radar detection. The computational algorithm for identifying targets and performing Doppler processing can be implemented in the FPGA. The notional model of the DSP section consists of an array of demodulators and threshold detectors. A fast Fourier transform (FFT) within the NI-5668R analyzer can be used to differentiate the Doppler components; however, frequency spacing(s) could also be dynamic and uneven, as in the case with FSCR.
Implementation of FSCR requires precise synchronization with each frequency step along with coherent demodulation. In modern DSP-based receivers, increased bandwidth and coherent digital downconverters (DDCs) support broadband FSCR systems while maintaining dynamic range.
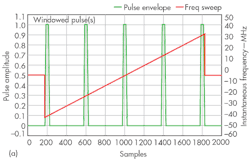
As shown in Fig. 5, a stepped chirp can be derived from a continuous chirp, but the pulses will gate the frequency ramp. In practice, the pulses can be modified with a window function, rather than using simple rectangular pulses. A Kaiser window is used in this example, and the data will show a more efficient spectral footprint. In terms of hardware, it is often easier to realize complex waveforms by means of an arbitrary waveform generator (AWG) that by other forms of signal generators.
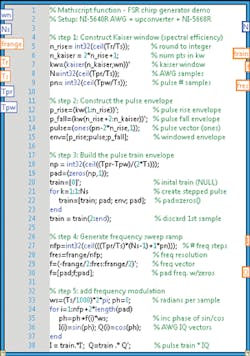
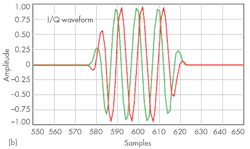
In such a case, the pulses will gate the I/Q sweep generation of the AWG. The pulse shaping in the time domain will be due to the Kaiser window function. For the programming example of Fig. 6, LabVIEW Mathscript code from National Instruments was chosen because its syntax is familiar to DSP programmers. The input parameters “wn” and “Ns” correspond to the window-smoothing factor and the number of frequency steps.
The effectiveness of a model can be evaluated by comparison to measurements, and this approach was used to check the modeled spectrum of the FSCR signal. The modeled spectrum and the measured spectrum show nearly 15-dB suppression between frequency bins, with ultimate out-of-band rejection of at least 40 dB relative to any frequency peak and more than 66 dB relative to the total channel power of -26 dBm.
In theory, each of the five spectral components will also share power equally, since the maximum spectral energy for each pulse is centered on its frequency at the time of the chirp. Parseval’s Theorem states:

where:
(pv2n) = the energy per pulse;
NP = the number of pulses; and
NB = the number of frequency bins (NP = NB).
The integrated power in the frequency bins should equal the sum of the power of all the pulses. By extension, assuming each pulse has a unique frequency, each pulse’s energy in the frequency domain will be equally weighted and will be equal to 1/Ns of the total energy.
This file type includes high resolution graphics and schematics when applicable.
Conclusion
This file type includes high resolution graphics and schematics when applicable.
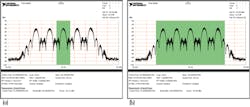
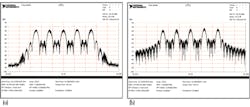
Figure 7 provides a comparison of the spectral power in one frequency bin to the total power. The measured power in the central 20-MHz portion of the FSCR spectrum is -32.71 dBm while the entire spectrum measures -25.9 dBm. The measured power ratio is:
P20/P100 = 10exp{[-32.71 – (-25.9)]/10} = 0.208 ≈ 1/5
Figure 8 compares the measured spectral efficiency due to the Kaiser windowing of the pulse envelope. The windowed version shows nearly a 20 dB improvement in the adjacent channel.
Radar systems are being used in a growing number of applications. But modern radar systems can be quite complex, due to signal processing algorithms designed to eliminate false detections, identify multiple targets, and read data from multiple sensors. Still, these radar systems should be designed for maximum spectral efficiency and dynamic range.
FSCR systems in particular are signal processing intensive, so it is quite useful to model the hardware and algorithms comprising these systems. Fortunately, modern software and test tools, such as VSS and wideband VSAs, make it possible to effectively model even complex radar systems before committing to any particular lineup of hardware components and system algorithms.
Frank Raffaeli, Principal RF/Microwave Engineer
Trang D. Nguyen, Master Project Manager
National Instruments, Inc., 11500 N. Mopac Expwy., Austin, TX 78759-3504; (800) 631-6088, (512) 683-0100, FAX: (512) 683-9300
References
1. K. Pourvoyeur, R. Feger, S. Schuster, A. Stelzer, and L. Maurer, “Ramp Sequence Analysis to Resolve Multi-target Scenarios for a 77-GHz FMCW Radar Sensor,” Proceedings of the 2008 11th International Conference on Information Fusion, June 30-July 3, 2008, Cologne, Germany, Informatik.
2. K. Alexiev and L. Bojilov, “A Hough Transform Track Initiation Algorithm for Multiple Passive Sensors, Bulgarian Science Fund,” Grant No. I-801/98.
3. AWR Corp.
This file type includes high resolution graphics and schematics when applicable.
