Spectrum Analyzer Packs a Powerful Punch
Download this article in PDF format.
Any RF engineer or technician knows that the spectrum analyzer is one of the most essential test instruments—no test lab is complete without one. Today, spectrum analyzers range from more traditional benchtop instruments to portable USB-based versions. In addition, purchasing a spectrum analyzer requires one to have certain knowledge in terms of their characteristics, such as understanding the difference between swept-tuned and real-time spectrum analyzers. It should come as no surprise, then, that a wide variety of spectrum analyzers populate the market today.
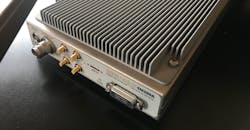
One of the latest spectrum analyzers to arrive is Signal Hound’s SM200A, which the company describes as a high-performance 20-GHz spectrum analyzer and monitoring receiver. Since Signal Hound was kind enough to loan me an SM200A, this article takes a hands-on look at the equipment, exploring some of its many features (Fig. 1).

1. The SM200A is a 20-GHz spectrum analyzer and monitoring receiver.
An Introduction to the SM200A
Although the SM200A was released earlier this year, it was actually a few years in the making. In fact, Signal Hound showcased the SM200A at IMS 2017 in anticipation of it being released before the end of last year. Of course, that didn’t happen.
So why was the SM200A delayed? A blog post from Signal Hound, “Adventures in hardware development: the case of our ‘missing’ 20 GHz spectrum analyzer, the SM200A,” provides the answers. It explains some of the challenges that arose along the way, as well as how the engineering team at Signal Hound overcame them. The company officially launched the SM200A in early 2018.
While Signal Hound had already been offering spectrum analyzers like the BB60C, the SM200A differs from those for several reasons. For one, it has a higher frequency range, operating all the way to 20 GHz. The SM200A is also substantially larger than the firm’s other test instruments due to the performance capabilities that were built into its package. It measures 28 × 20 × 13 cm and weighs 3.93 kg.
Another difference lies in how the SM200A is powered. Like Signal Hound’s other instruments, the SM200A connects to an external PC via a USB cable. The PC displays the measurements and provides the user with the controls needed for operation via a software program. However, the SM200A is not USB-powered like other Signal Hound test instruments—it’s powered separately.
The SM200A’s overall frequency range extends from 100 kHz to 20 GHz. It achieves 160 MHz of instantaneous bandwidth along with 110 dB of dynamic range. One notable feature of the SM200A is its 1-THz/sec. sweep speed at 30-kHz resolution bandwidth (RBW).
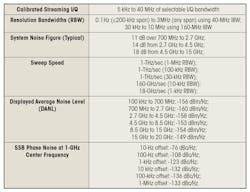
The analyzer can also measure phase noise, with performance that in Signal Hound’s own words is “low enough to contribute less than 0.1% error to error-vector-magnitude (EVM) measurements and rival even the most expensive spectrum analyzers on the market.” Additional specifications are listed in the table above. To get further perspective on what makes the SM200A tick, block diagrams of its front end and signal-processing functionality are revealed in Figures 2 and 3, respectively.
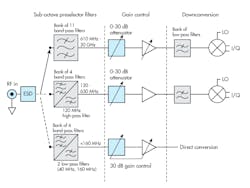
2. Shown is a block diagram of the SM200A’s front end.
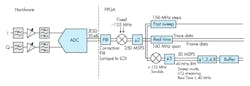
3. The block diagram offers a bird’s-eye view of the SM200A’s signal-processing chain.
The SM200A is intended to be used with the Spike spectrum-analyzer software, which can be downloaded from the company’s website. Those who have prior experience using any of Signal Hound’s spectrum analyzers should already be familiar with Spike, since the software is used throughout its analyzer lineup.
Getting Started with the SM200A
Now let’s explore some of the analyzer’s features. Signal Hound’s VSG25A vector signal generator (VSG) is used to generate the signals that are being measured by the SM200A (Fig. 4). As can be seen, both instruments are connected to a laptop via USB cables.
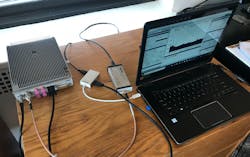
4. This measurement setup featured the SM200A and VSG25A.
Figure 5 shows the Spike software when first starting the program. In this case, the SM200A is measuring a 1-GHz continuous-wave (CW) signal from the VSG25A. All of the typical spectrum-analyzer settings are depicted here.
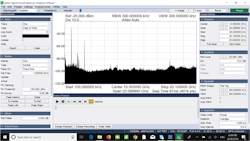
5. The "Sweep" analysis mode, which is essentially a traditional spectrum-analyzer measurement environment, is Spike’s default analysis mode.
Clicking on the Analysis Mode tab in the top menu reveals the various analysis options. When first starting Spike, the default analysis mode is Sweep, shown in Fig. 5. The Sweep analysis mode essentially represents a traditional spectrum-analyzer measurement environment in which the analyzer sweeps across a desired span. Additional analysis modes include Real-Time, Zero-Span, Harmonics, Phase Noise, Digital Modulation Analysis, EMC Precompliance, Analog Demod, and Interference Hunting. The wide array of analysis modes is what makes the SM200A such a versatile instrument.
Making Phase-Noise Measurements
One significant aspect of the SM200A is its phase-noise measurement capability. To measure phase noise, one must simply click the Analysis Mode tab and then select Phase Noise from the subsequent dropdown menu.
Figure 6 reveals phase-noise measurements at two different carrier frequencies. Trace 1 (black) and Trace 2 (blue) depict phase-noise measurements of an active 1-GHz signal. Trace 1 represents a “normal” measurement, while Trace 2 represents an “average” measurement. For an “average” measurement, a user-specified number of traces are averaged to create an average phase-noise measurement trace. Users can specify the number of traces to average by entering a value for Avg Count in the Trace Settings area. In this example, Avg Count is set to 10, which is the default value.

6. In this phase-noise analysis, the three traces represent measurements at two different carrier frequencies.
Trace 3 (pink) depicts a “reference” measurement. In this case, it represents a previous phase-noise measurement of a 2-GHz signal. That phase-noise measurement trace was then set to a “reference” trace, which is simply a trace that’s not updated after each phase-noise sweep. This feature is useful for comparing the phase-noise performance of a source at two different frequencies, as is the case here. It could also help to compare the phase noise of two different sources. All traces can be configured in the Trace Settings area.
Vector Signal Analysis
One noteworthy analysis mode is Digital Modulation Analysis. With Digital Modulation Analysis, the SM200A can essentially function as a vector signal analyzer (VSA). The SM200A supports a very wide range of modulation formats, including BPSK, QPSK, OQPSK, and 8PSK, among others. It also supports 16-QAM, 32-QAM, 64-QAM, and 256-QAM.
As an example, we’ll look at a 1-GHz 16-QAM signal. Figure 7 shows an analysis of this signal. Included is a constellation diagram along with an error summary, which displays a read-out of various metrics like EVM, magnitude error, phase error, frequency error, and more. Here, the peak EVM is just 0.26%.
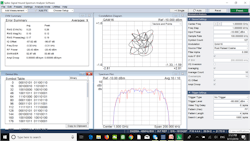
7. Digital modulation analysis was performed on a 1-GHz 16-QAM signal.
Also seen in Fig. 7 is a spectrum plot along with a table that displays the demodulated bits of the input signal. The number of demodulated bits shown is equal to the specified symbol count multiplied by the number of bits each symbol represents for the selected modulation type. In this case, a 16-QAM signal is being analyzed (4 bits per symbol). Since the signal count is set to 127, the total number of demodulated bits in this example is 508 (127 × 4).
Additional measurement options can be viewed by clicking the Add Measurement dropdown, which is shown in the upper left-hand area of Fig. 7. Options include Eye Diagram, EVM vs Time, Mag Err vs Time, Phase Err vs Time, and more. In essence, users can select the measurements to display to meet their specific needs.
Additional Capabilities and Closing Thoughts
The SM200A offers plenty of other measurement options, too, such as zero-span mode, analog demodulation analysis, and more. With zero-span analysis, users can record and playback I/Q waveforms. The sweep recording and playback capability, along with the sub-octave filters, makes the SM200A well-suited for spectrum-monitoring applications.
Of course, as its name implies, the SM200A is a real-time spectrum analyzer, which is critical for interference-hunting applications. And while the SM200A is equipped for such applications, a deeper look into that facet of the analyzer is probably worthy of its own article. Signal Hound has also published an application note, “Introduction to Interference Hunting with Spike.” The document dives into the topic of interference hunting in greater detail, explaining how to configure the Spike software for such measurements.
In summary, the SM200A certainly packs a great deal of performance capabilities into a single instrument. With its array of analysis modes at a price tag of just $11,900, the SM200A can hold its own in today’s market. It appears that Signal Hound may have a winner on its hands.

