Achieve Accurate RF Measurements by Understanding Spectral Purity
Spectral purity is a signal's characteristic stability. For testing purposes, a signal must remain stable in the short and long term. Selecting a signal generator with high spectral purity ensures that the measurements describe the device under test’s (DUT’s) performance rather than the signal generator’s limitations.
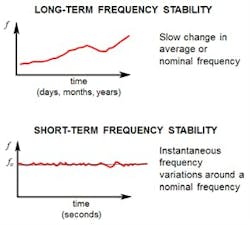
Drift or long-term stability is typically defined over a period of more than a second. Current signal-generator technology generally offers good long-term stability.
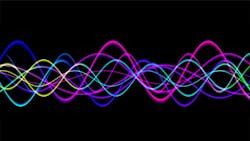
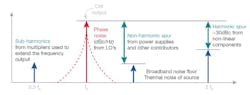
The primary concern is frequency changes in less than a second: short-term stability. These fluctuations are caused by non-deterministic signals like noise, 1/f flicker noise, and shot noise that modulates the carrier (Fig. 1). Such perturbations impact both amplitude and phase.
A tuning fork emits an almost perfect tone with which one might tune a musical instrument. It’s a good analogy for demonstrating the importance of signal purity. A signal generator works like a tuning fork, emitting an almost perfect signal used in diverse RF applications such as clock references, RF power-amplifier testing, adjacent-channel sensitivity testing, and many more. The integrity of the signal-generator output is what we refer to as spectral purity.
Robust signal generators output signals with as little imperfection as possible. However, random amplitude and/or phase fluctuations occur in real-life waveforms. In the time domain, a waveform has amplitude and phase shifts. Meanwhile, the signal exhibits frequency and amplitude modulation in the frequency domain. The main measurements for spectral purity are spurs, phase noise, and harmonics.
This article explores the concept of spectral purity and why it matters.
>>Download the PDF of this article, and check out the TechXchange for similar articles and videos

What are Harmonics, Spurious Emissions, and Phase Noise?
Both harmonics and spurious emissions are deterministic (non-random) signals generated from mixing or dividing signals to create an output signal. These frequencies aren’t desired in RF systems. The harmonics are integer multiples of the carrier frequency, while the spurious frequencies are non-integer multiples.
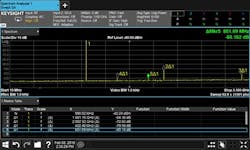
Figure 2 shows a 1-GHz carrier frequency and its harmonics, as well as spurious emissions. The 2nd harmonic (marker 2) is −64.36 dBc relative to the fundamental carrier (marker 1), and the 3rd harmonic (marker 3) is −72.83 dBc. Markers 4 and 5 designate spurs.
It’s crucial to select a signal analyzer with high dynamic range to measure harmonics and spurs. Otherwise, the detected harmonics and spurs may come from the signal analyzer itself and not the DUT.
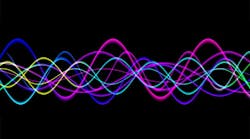
Phase noise is the noise spectrum around an oscillator signal in the frequency domain. It describes an oscillator's frequency stability. In Figure 3, you can see a signal’s phase noise and other non-ideal components.
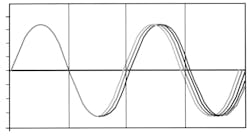
Frequency stability has two components: long and short term (Fig. 4). Short-term fluctuations contribute to phase noise, while long-term drifts affect accuracy (see table).

Phase noise is commonly defined as the amount of single-sideband (SSB) power contained within a 1-Hz bandwidth at a specific frequency away from the main frequency. This equation explains it:
£(f) = Noise power in a 1-Hz bandwidth / main frequency power where £(f) has units of dBc/Hz
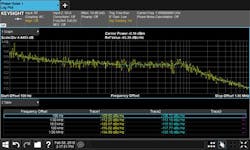
Figure 5 shows a signal generator’s SSB phase-noise measurement. The yellow trace indicates instantaneous power measurements, and the blue trace is the average result.
When Phase Noise Matters
Understanding the impact of phase noise on measurements is vital for getting the right test performance level. High phase noise obscures weak signals close to the main frequency.
Let’s look at how this applies to radar applications. Radar systems require excellent phase noise. A radar sends pulses at a defined frequency and measures how the returning pulse’s frequency has changed. Changes in frequency tell us about the target’s velocity as defined by the Doppler effect. A slow-moving object generates a slight shift in the returning pulse’s frequency.
In Figure 6, the “signal of interest” is the moving target’s returning pulse, and the “interfering signal” is the fixed object’s returning pulse. The radar receiver can’t identify the moving object if the phase noise masks the downconverted signal of interest.
What Does Spectral Purity Mean for Digital Modulation?
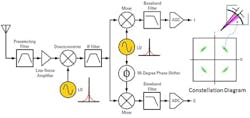
Figure 7 illustrates a simplified quadrature phase-key-shifting (QPSK) digital receiver block diagram. The local oscillator (LO) signal’s phase noise is translated into the mixer’s output. Phase noise creates radial smearing of the symbols (shown in green) on the constellation diagram. Overlapping radial smears for closely spaced symbols in a higher-order modulation scheme, such as 256 QAM, results in poor receiver sensitivity.
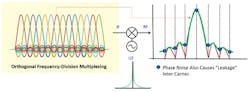
Orthogonal frequency-division multiplexing (OFDM) is a common modulation scheme for wideband digital communication. It uses many closely spaced orthogonal subcarrier signals to transmit data in parallel (Fig. 8). LO phase noise causes the subcarriers’ phase noise to interfere with other subcarriers, degrading the OFDM signal’s modulation quality.
You can adjust phase noise at the synthesizer section of sophisticated signal generators. This allows you to reduce the phase-noise performance and helps in assessing your receiver design's sensitivity.
Implications of Spectral Purity for Mobile Radio Applications
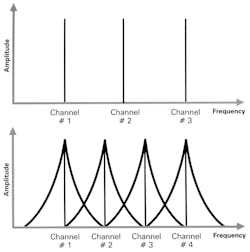
Radio channel spacings will decrease as the available spectrum becomes scarcer (Fig. 9). This puts a tighter constraint on engineers to design more selective receivers. To test receiver selectivity, a signal generator must have good spectral purity. If not, you’ll be testing your signal generator and not your receiver.
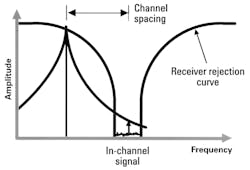
Adjacent channel selectivity is one common measurement of whether the receiver rejects unwanted signals. Figure 10 shows a receiver intermediate frequency (IF) passband with an in-channel signal set to a specific sensitivity level. A second signal generator is fixed one channel spacing away. The signal’s amplitude is increased until it breaks through the passband and distorts the in-channel signal. The difference between the two signal levels is called adjacent channel selectivity.
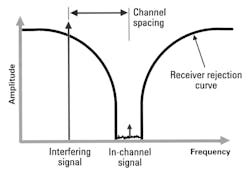
Figure 11 shows what occurs when a signal generator has high phase-noise levels. The phase noise crosses into the passband, distorting the desired signal and making the receiver look worse than it is.
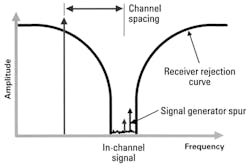
Spurious signals cause problems like those of phase noise (Fig. 12). Suppose a spurious signal shows up in the radio channel spacing. In that case, you will measure the amplitude difference between the spurious signal and the out-of-channel signal generator.
Phase Noise Affects Local-Oscillator Substitutions
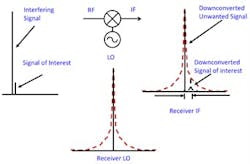
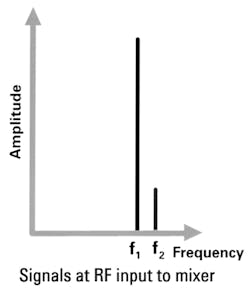
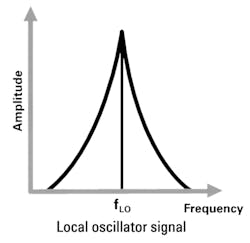
Signal generators used as LOs need low phase noise. Let’s look at two signals, f1 and f2, in Figure 13. These signals will be mixed with a local-oscillator signal (Fig. 14) down to an IF, where highly selective IF filters can separate one of the signals for amplification, detection, and baseband processing. Recovering the desired signal should be easy if it’s the larger signal.
Any phase noise on the local-oscillator signal is translated directly to the mixer products. If the smaller signal is preferred, the translated noise in the mixer output may completely hide it (Fig. 15).
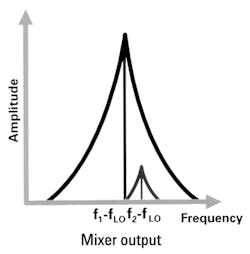
The smaller signal’s mixing product is no longer recoverable, even though the receiver’s IF filtering removes the larger signal’s mixing product. This effect worsens in highly selective receivers with a wide dynamic range.
Wireless devices are adding more advanced RF capabilities, with more test setups under varying conditions. Testing additional frequency bands, more advanced standards, and antennas increases production and verification testing challenges.
For example, 6G’s proposed requirements of ultra-fast download speeds, highly complex modulation schemes, and wider bandwidths will make signal purity even more critical. Therefore, test results must be generated quickly and reliably, which requires signal generators to produce pure and precise signals.
>>Download the PDF of this article, and check out the TechXchange for similar articles and videos
About the Author

Brian Whitaker
Product Marketing Engineer, Keysight Technologies
Brian Whitaker is a product marketing engineer responsible for AC and DC power supplies and electronic loads at Keysight Technologies. He has extensive experience in various technology fields, having worked for Texas Instruments, 3M, SolarWinds, and Ping Identity before joining Keysight Technologies.
