Spot Unlicensed Spectrum with a Real-Time Analyzer
This file type includes high resolution graphics and schematics when applicable.
Wireless activity continues to increase as more and more frequency bands are occupied by popular applications—among them Bluetooth, ZigBee, IEEE 802.11, and Wi-Fi. With the emergence of the Internet of Things (IoT), demand is growing for low-cost, easy-to-implement chipsets to enable wireless connectivity.
These chipsets are attractive because they utilize unlicensed radio spectrum, and many solutions are available with reference designs which have already achieved regulatory approval. Managing the many different electronic devices soon to be communicating by means of IoT connections will require reliable knowledge of occupied frequency bands. Such knowledge can be provided by the versatile measurement capabilities of a real-time spectrum analyzer.
The 2.4-GHz spectrum is arguably the most popular unlicensed frequency band for low-cost communications applications, and even applications like microwave ovens (where the only communication occurs when the final buzzer sounds for a meal). Thousands of radios are operating in the 2.4-GHz band, making use of the unlicensed (free of charge) frequency spectrum.
Of course, with many different radios and applications in the same frequency band, effective spectrum sharing is necessary. This is usually performed by means of advanced hardware and software within a radio, including:
- Time-domain multiple access (TDMA) techniques that enable transmitting and receiving on the same frequency channel;
- Clear channel assessment, by which a radio can monitor the activity in its designated band to find the optimum timing for a transmission; and
- Adaptive frequency control, such as frequency hopping, to make efficient use of available frequency spectrum. This is accomplished by changing to portions of a frequency band as they are available, and free from interference from other signal sources in the band.
Engineers are finding that even when they use a “certified” solution, they are still having problems establishing a radio link and maintaining communications within a particular portion of the radio spectrum. The challenge becomes how to troubleshoot a radio link for its activity and how to work a new application into that frequency band.
Spectrum analyzers have long been the instruments of choice for monitoring and measuring signal activity in the radio spectrum (to gain a better understanding of the key parameters used for comparing analyzer models, click here). A number of different architectures are available for commercial spectrum analyzers, including swept-tuned and real-time spectrum analyzers.
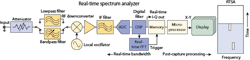
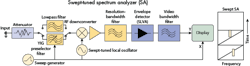
Figure 1 offers a simplified block diagram of a traditional swept-tuned spectrum analyzer. It employs a superheterodyne radio architecture that can process and measure a wide range of frequencies by translating them to lower intermediate frequencies (IFs) for processing and analysis.
When attempting to characterize modern signals like Wi-Fi, the challenge in using the superheterodyne spectrum analyzer lies in the “sweeping” nature of its operation. What is measured on the analyzer’s spectrum display is disjointed in time and may not provide an accurate representation of the spectral information as a function of time (especially for TDMA signals). Even the fastest swept-tuned spectrum analyzers only provide a limited view of a frequency-hopped transmitter.
In addition to the basic frequency versus amplitude display, some superheterodyne spectrum analyzer manufacturers provide spectrogram information. In a swept-frequency spectrum analyzer, this information is derived from multiple sweeps; the timing information on display can only approximate what may be happening with a pulsed or frequency-agile transmitter.
In contrast, a real-time spectrum analyzer (RTSA) provides the same basic functionality as a traditional swept-tuned superheterodyne spectrum analyzer, but with a number of added benefits. Figure 2 shows a block diagram of a basic RTSA. One of the key differences between an RTSA and a basic swept-tuned spectrum analyzer is in the RTSA bandwidth specification.
For any span up to the maximum real-time frequency span of the instrument, an RTSA does not sweep and can continuously capture spectrum information. The Tektronix RTSA family also is not limited to a single display at one time. Rather, spectrum, spectrogram, and modulation information can be simultaneously measured in a time-correlated display, since this data has been captured from the continuous acquisition of the signal within the span of interest.
Important RTSA features include:
- Fast spectral analysis rates from 10,000 to 3,400,000 spectrums per second;
- Seamless recording of an RF/microwave signal environment over time;
- Triggering by means of time, frequency, amplitude, and RF density; and
- The capability to make measurements that are correlated in terms of time, frequency, and modulation.
A RTSA is particularly useful when analyzing systems that employ a TDMA protocol, such as Wi-Fi and Bluetooth systems. One of the biggest problems for devices that operate in license-exempt frequency bands is managing the effects of multiple transceivers sharing the same spectrum. Regulatory requirements almost always require that devices operating in unlicensed frequency bands to not cause interference, and must accept any interference that is present. An RTSA is an ideal tool for quantifying the effects of interference, since as it is capable of continuously capturing spectrum information.
This file type includes high resolution graphics and schematics when applicable.
Getting Connected
This file type includes high resolution graphics and schematics when applicable.
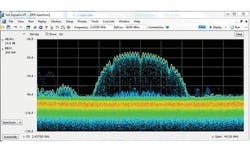
In addition, with newer RTSAs capable of being controlled over a standard Universal Serial Bus (USB), they can easily be connected to laptop computers and other computing devices. As an example, Fig. 3 shows a digital phosphor spectrum display from a USB-based RTSA well suited to spectrum characterization and management applications. As with the display of a traditional swept-tuned superheterodyne spectrum analyzer, the RTSA display provides signal amplitude as a function of frequency, for a portion of bandwidth of interest.
One of the most important features of an RTSA is the capability of the instrument to employ color to show how RF energy is measured at a particular pixel (the pixel occupancy). The digital phosphor spectrum measurement makes it possible to specify a decay function, providing a phosphorescent effect which mimics the display effects found in older CRT-based oscilloscopes. These features add the dimension of periodicity to a display, making it possible to display how often a signal is being measured during a span of interest.
This type of real-time display in a RTSA makes it possible to graphically present what a classic RF receiver sees, providing greater insight into what is taking place over a frequency span of interest. But it doesn’t provide enough information about the potential effects of interfering signals. By their nature, spectrum displays cannot show the time interleaving of different signals. Employing a “zero-span” measurement capability would provide good detail about pulse amplitude and duration, but not about frequency information.
The spectrogram measurement is designed to address this type of problem. Like a traditional spectrum display, it will show low-frequency information on the left-hand side and higher-frequency information on the right. Unlike a basic spectrum-analyzer display, color is used to represent amplitude, and all of this information is plotted versus time on the y-axis. The spectrogram is effectively a strip chart recorder showing spectrum activity over time.
In a swept-tuned spectrum analyzer, the spectrogram will be disjointed in time as the instrument is sweeping. The spectrum analyzer sweeps through frequency, meaning that trace points on the left-hand side of the span occur at earlier times than trace points on the right-hand side of the span. As such, there can be no timing relationships within a spectrogram captured by a swept-frequency analyzer.
In contrast, a spectrogram created by a RTSA is comprised of continuously recorded spectral data, without sweeping a bandwidth of interest. The RTSA has the added benefit of complete domain correlation, so information in the spectrogram can be directly correlated with other measurements (i.e., modulation, power, and CCDF).
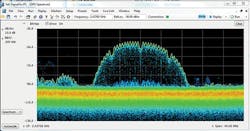
Figure 4 offers an example of a digital phosphor display in conjunction with a spectrogram. The digital phosphor display shows a great deal of detail on signals that are present. In the center of the display, a lower-level wideband signal exhibits a large crest factor. Given the bright, or “hot,” coloring for this display, this signal has a high level of channel occupancy (nearly continuous).
A Wi-Fi signal can also been seen in the display, operating at 2.437 GHz (Wi-Fi channel 6). There are also more than 10 other signals in the display at varying frequencies and power levels. Given the spectrum shape and frequencies in use, these signals are probably from a Bluetooth device.
At first glance, it appears that there would be a great deal of co-channel and adjacent-channel interference among the various devices operating in this monitored frequency span. However, the analyzer’s digital phosphor display is not showing the complete picture. In order to provide a source of synchronization, a basic power trigger was employed to synchronize signal acquisition with the large amplitude of the Wi-Fi signal. The instrument was set up to acquire 10 ms of continuous RF signal information each time a trigger was generated.
An RTSA makes it possible not only capture real-time spectrum data, but to also record (and play back) seamless blocks of spectrum information. The spectrogram on the left-hand side of Fig. 4 shows multiple 10-ms acquisitions. With the added dimension of time, it is possible to clearly observe the time interleaving occurring between various wireless systems sharing this portion of frequency spectrum.
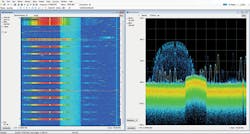
The Wi-Fi signal is a short-duration pulse, unchanging either in frequency or power level. Centered on or about 2.4453 MHz, there is a lower-amplitude continuous signal with a root-cosine (“square-top”) spectral shape. Multiple signal bursts (approximately 1 MHz wide and Gaussian shaped) can also be seen in the frequency span
These signals are exhibiting the behavior of Bluetooth signals, and it can be seen how these signals are time-interleaved with other emissions in the span. In addition, it is possible to observe some adjacent-channel interference which can be directly correlated to the Wi-Fi signal on channel 6.
As can be seen in this analysis, there are a number of co-channel services utilizing the same RF spectrum. By using active spectrum-sharing techniques, the different signals are time interleaved so that they can co-exist within the same frequency spectrum, and there is little or no loss of link quality. Because of the growing number of services sharing different unlicensed frequency bands, it is easy to see why measurement tools such as RTSAs are needed for monitoring and measuring these crowded frequency bands.
Robin Jackman, Field Applications Engineer
Tektronix, Inc., 14200 SW Karl Braun Dr., P.O. Box 500, Beaverton, OR 97077; (877) 977-0425
This file type includes high resolution graphics and schematics when applicable.
