Make Accurate Impedance Measurements Using a VNA
Download this article in PDF format.
A vector network analyzer (VNA) is a very useful test instrument for characterizing RF circuits and amplifiers. But what about measurements of simple passive components? What’s the best way to characterize a chip capacitor or an inductor—or even a resistor?
In the past, without giving it much thought, this author has measured chip capacitors by grounding one end. After doing a careful port extension to the end of a homemade probe, the cap would be measured with the Smith chart mode engaged and read off the value from an R + jX marker. As it turns out, this method is only appropriate for a narrow range of component impedances and this measurement probably had significant error.
Three measurement configurations exist for impedance measurements: shunt, shunt-thru, and series (Fig. 1).
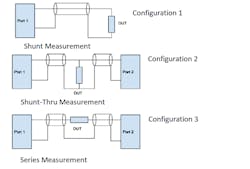
1. Shown are the shunt, shunt-thru, and series configurations for impedance measurements.
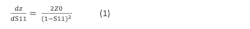
For the three measurement configurations, we want to understand the uncertainties of the measurements. This is normally done by using the Jacobian operator on the variables, which affects the outcome. In this case, there’s only one variable, either S11 for configuration one, or S21 for configurations two and three. The Jacobian will require the partial derivatives of the impedance, Z, with respect to the measured reflection coefficient. Here are the needed derivatives for the three configurations:
Configuration 1: Shunt Measurement
By definition:

Solving for Z:

We want to know the sensitivity of Z with respect to changes in S11, so we’ll need the derivative:
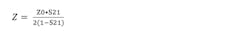
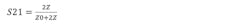
Configuration 2: Shunt-Thru Measurement
Moving on to the second configuration of Figure 1, the shunt-thru measurement, we have:
Rearranging to solve for Z, we get:
And then taking the derivative to find the sensitivity of Z with respect to changes in S21:

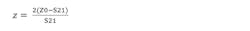
Configuration 3: Series Measurement
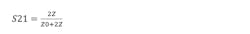
Finally, for the series configuration, we need to find S21, which in this case is:

Solving for Z once again gives:
And the derivative needed for sensitivity is:
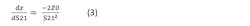
Note that the negative sign here is irrelevant, since we will only be interested in the magnitude.
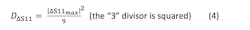
Impedance Accuracy for Configuration 1: Shunt Measurement
We want to find the error dispersion (variance) on the impedance, Z, for each of these cases. For configuration 1, the measurement involves S11. The specification sheet for the VNA gives a maximum error on S11 magnitude (ΔS11max). To compute statistics, we take this to be the 3σ value of a normally distributed function (99.7% confidence interval). We’ll use this to calculate ΔZmax, which will be a 3σ value for the expected change of impedance.
The dispersion on S11 is then:
In general, errors are propagated forward using the Jacobian differential operator. Thus:
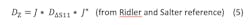
For a single independent variable, this simplifies to the dispersion (variance) on S11 multiplied by the square of the partial derivative. It’s important to introduce Equation 5, though, since it’s central to calculating uncertainties where multiple variables are involved with non-zero covariance. In this simple case, one variable is the square of Equation 1. Multiplying by the dispersion on S11 gives:
Assuming ΔZmax is 3σ = 3 * √DZ (99.7% confidence interval again) or:
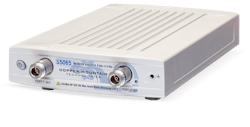
The Copper Mountain Technologies S5065 VNA can measure from 9 kHz to 6.5 GHz, making it ideal for evaluating power plane impedances and measuring inductors and capacitors that might be used in RF designs (Fig. 2). The reflection accuracy (S11) of this device is specified to be ±0.4 dB for measurements from −15 to 0 dB.
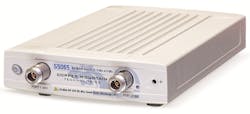
2. The S5065 VNA has a measurement frequency range of 9 kHz to 6.5 GHz.
Assuming that the datasheet spec of 0.4 dB for S11 accuracy is a 3σ spec, one sigma would be 0.13 dB, or 0.0154 in linear terms. Then:

Then:

And now ΔZmax may be evaluated as a function of Z. The measurement error of Z as a function of Z is less than 10% from about 2.5 to 250 Ω. Below and above that range, this measurement method will exhibit very high errors.
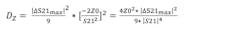
Impedance Accuracy for Configuration 2: Shunt-Thru Measurement
Using Equation 5 again:
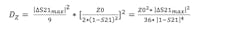
Using Equation 2 and following the same logic we arrive at:

Here, ΔS21max is the maximum expected error on S21, which will come from the datasheet. Copper Mountain Technologies’ S5065 VNA has specified accuracy on S21 of ±0.2 dB for S21 values of −60 to 0 dB over most of the frequency range, or 0.0228 in linear terms.
Again, assuming ΔS21max is a 3-sigma value and squaring to get variance, DΔS21.
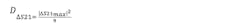
For a 3σ ΔZmax, it’s 3σ = 3 * √DZ (99.7% confidence interval again) or:

Assuming that ΔS21max is 0.2 dB on any S21 value, then in linear terms, the delta is 0.0228 * S21. So, we can plot:

and
Impedance Accuracy for Configuration 3: Series Measurement
From Equation 5:
Assuming ΔZmax is 3σ = 3 * √DZ (99.7% confidence interval again) or:
Using the same value for ΔS21max = 0.0228 from above:

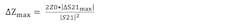
Figure 3 shows the percent error on the measurement of impedance using the three different methods and using the datasheet values from the S5065 VNA for ΔS11max and ΔS21max.
3. Here, impedance error is shown for the shunt, shunt-thru, and series configurations.
The shunt error doesn’t actually go to zero. The error on the very low reflection would round off the point to about 1%. What’s important is the relationship between the three curves. The shunt measurement is best for impedances from 20 to about 80 Ω, while the other two methods work best below and above that range.
4. This 2-mΩ resistor was measured by the S5065 VNA.
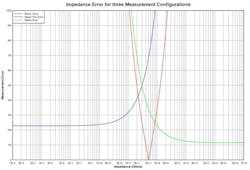
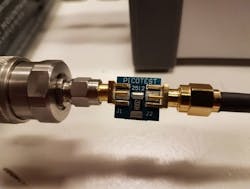
As an example, a 2-mΩ resistor was measured with the S5065 VNA, which can measure from 9 kHz to 6.5 GHz using the shunt-thru method (Fig. 4). The test setup includes Picotest’s common-mode transformer (model J2102B-N) (Fig. 5).
5. Included in the test setup was the J2102B-N common-mode transformer.
The common-mode transformer is needed to remove the resistance of the cable shield from the measurement. Because this is a shunt measurement, the return is through the system ground and it’s important to deal with the parasitic ground resistance to get a good measurement of a low impedance. The transformer does this and maintains a good 50-Ω match up to about 300 MHz. Figure 6 shows the measurement results.
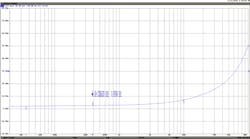
6. The resistor measurement revealed a value of 2.085 mΩ at 35 kHz.
The measurement looks very solid and shows 2.085 mΩ at 35 kHz. As the frequency increases, the lead inductance becomes apparent and the impedance rises quickly. This might seem unlikely, but since the resistance is so small, it doesn’t take much lead inductance to cause this to occur. In this case, it’s about 80 pH.
Clearly, if one was depending on this resistor to be 2 mΩ at 100 MHz, there would be a problem.
This same measurement setup may be used to easily evaluate the capacitance, self-resonance, and equivalent series resistance (ESR) of capacitors, as well as the inductance, resistance, and self-resonance of inductors. To facilitate these measurements, Copper Mountain Technologies offers fixturing (Fig. 7).
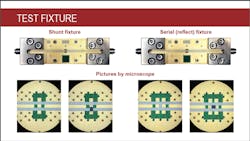
7. Shown are various test fixtures from Copper Mountain Technologies.
Calibration is accomplished through regular cable calibration followed by fixture removal (Figs. 8 and 9).
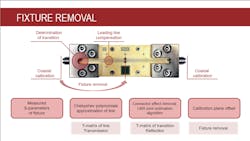
8. Fixture calibration is depicted here.
9. Different forms of the measurement test stand can be used.
Conclusion
It’s important to understand how to make impedance measurements with a VNA to achieve the best accuracy. Hopefully, the exploration of the three methods in this article has made it clear how to accomplish this task. Thanks to Steven Sandler at Picotest for supplying the common-mode transformer and the many test coupons, including the 2-mΩ shunt used here.
Brian Walker is Senior RF Design Engineer at Copper Mountain Technologies.
References
A.A. Savin, V.G. Guba, O.N. Bykova, Measurement of Electronic Component Impedance Using a Vector Network Analyzer, UDC 621.317.33.
Steven Sandler, “Power Integrity Measurements with CMT VNAs and Picotest Accessories,” 2018.
Nick M. Ridler and Martin J Salter, Centre for Electromagnetic and Time Metrology, Propagating S-parameter uncertainties to other measurement quantities.

About the Author
Brian Walker
Senior RF Engineer SME, Copper Mountain Technologies
Brian Walker is the Senior RF Engineer SME at Copper Mountain Technologies where he helps customers to resolve technical issues and works to develop new solutions for applications of VNAs in test and measurement.
Previously, he was the Manager of RF design at Bird Electronics, where he managed a team of RF Designers and designed new and innovative products. Prior to that he worked for Motorola Component Products Group and was responsible for the design of ceramic comb-line filters for communications devices. Brian graduated from the University of New Mexico, has 40 years of RF Design experience, and has authored three U.S. patents.
