Peak Power Sensors Offer More than Meets the Eye
Download this article in PDF format.
Power sensors are a specialty of Boonton Electronics, which has a significant presence in the RF power-measurement world. The company’s CPS2000 Series of true average connected power sensors was featured in an article last October titled, “Average Power Sensors Don’t Settle for Average Performance.” This article continues that theme by presenting a firsthand look at Boonton’s RTP5000 Series of real-time peak power sensors (Fig. 1). Boonton Electronics is a subsidiary of Wireless Telecom Group.
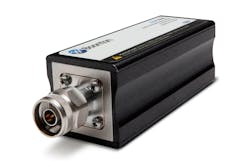
1. The RTP5000 sensors can perform 100,000 measurements per second.
A Rundown of the RTP5000 Series
The RTP5000 Series consists of five models: the RTP5006, RTP5318, RTP5340, RTP5518, and RTP5540. The RTP5006 operates from 50 MHz to 6 GHz; the RTP5318 and RTP5518 from 50 MHz to 18 GHz; and the RTP5340 and RTP5540 from 50 MHz to 40 GHz. The sensors are used together with the Boonton Power Analyzer software that’s downloadable from Boonton’s website. Once the software is downloaded, simply connect the sensor to the PC with a USB cable to begin.
The RTP5000 sensors feature Boonton’s Real-Time Power Processing (RTPP) technology. The company asserts that this technology enables the sensors to “capture, display, and measure every pulse, glitch, and detail with no gaps in data and zero latency.” Another aspect of these sensors that Boonton likes to emphasize is the 195-MHz video bandwidth and the capability to measure rise times down to 3 ns. The company says the 195-MHz video bandwidth is “six times greater than what alternative products achieve.” Therefore, according to Boonton, a video bandwidth in excess of 100 MHz makes the RTP5000 Series ideal for Wi-Fi and 5G signal characterization.
The RTP5000 sensors have a variety of use cases. Walt Strickler, VP/general manager at Wireless Telecom Group, says, “The main applications for the RTP5000 Series are characterization and design validation for commercial and military/aerospace radar, electronic warfare, and wireless communications (LTE, 5G, Wi-Fi).”
An Up-Close Look
Now, let’s dive deeper into the RTP5000 Series by demonstrating some actual measurements using two RTP5006 sensors. To get a basic feel for the sensors and the Boonton Power Analyzer software, let’s begin by showing a simple measurement of a pulsed-RF signal. In this example, a 2-GHz pulsed-RF signal will be measured with an RTP5006 sensor. The signal has a pulse width of 2 µs and a period of 10 µs.
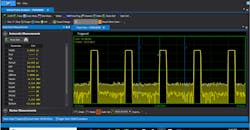
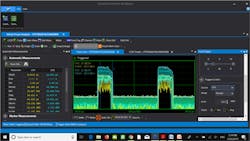
Figure 2 reveals a trace measurement of the 2-GHz pulsed-RF signal using the Boonton Power Analyzer software. One significant aspect is the Automatic Measurements feature, shown on the left of Figure 2. This feature provides users with instant access to 16 different measurements, including pulse width, rise time, fall time, period, pulse repetition frequency (PRF), duty cycle, and more.
2. Shown is a measurement of a 2-GHz pulsed RF signal.
Furthermore, it should come as no surprise that the software allows users to specify many of the measurement settings. For example, by clicking the Time/Trig tab, one can set the timebase, trigger delay, and trigger position. Users also are able to set the trigger source, trigger mode, trigger level, slope (positive or negative), and holdoff.
Gain and PAPR Measurements
Now that we’ve shown a very basic measurement, let’s move on to something a little more advanced. A Boonton demo aid will be employed for the following measurement example (Fig. 3).
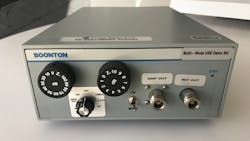
3. The demo aid is equipped with two output ports: REF OUT and AMP OUT.
The demo aid is quite a versatile box. Not only does it generate a signal, but also Gaussian noise. The noise can be used to effectively modulate the signal by toggling a switch on the front of the box.
The generated signal (with or without modulation applied by the noise source) then passes through a variable attenuator before being amplified by a 14-dB gain amplifier. The REF OUT port on the demo aid provides a reference of the generated signal before being amplified, while the amplified signal is provided through the AMP OUT port. Furthermore, the attenuation level can be adjusted using two dials.
When utilizing two sensors, it’s possible to perform measurements like gain and propagation delay. Here, we’ll look at a gain measurement. The demo aid will be used to generate a pulsed signal with a variable pulse width. An orthogonal-frequency-division-multiplexing (OFDM) signal can be replicated by modulating the pulsed signal with the noise source.
Two RTP5006 sensors will be used for this example. One of them is connected to the REF OUT port on the demo aid, while the other is connected to the AMP OUT port. The measurements are synchronized by connecting a cable from the MULTI I/O connector of one sensor to the same connector of the other. This MULTI I/O connector serves as a trigger synchronization interconnect when multiple sensors are employed.
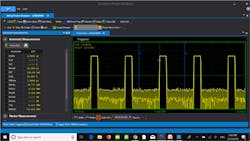
Figure 4 shows the trace measurement, with the pre-amplified measurement shown in yellow and the post-amplified measurement shown in blue. It should also be noted that the attenuation level of the demo aid was set to 10 dB.
4. Pre-amplified and post-amplified measurements are shown in yellow and blue, respectively.
After lowering the timebase to 5 µs/div, the markers can be placed in appropriate positions within the pulse for analysis (Fig. 5). The Marker Measurements display, shown on the left, reveals that the average power over the marker interval (denoted as MkAvg) of the pre-amplified measurement is −11.169 dBm. The average power over the marker interval of the post-amplified measurement is +2.814 dBm, revealing a gain of about 14 dB as expected.
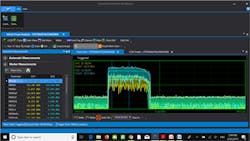
5. With the timebase set to 5 µs/div, the markers are placed within the pulse to measure gain.
With the markers remaining where they are, a complementary cumulative distribution function (CCDF) analysis can be carried out by clicking the CCDF tab. A CCDF analysis is an effective way to examine peak-to-average-power-ratio (PAPR). A CCDF curve shows the time that the signal spends at or above a given power level.1 The x-axis indicates how much the peak power exceeds the average power. The y-axis represents the percentage of time that the signal spends at or above the power level specified by the x-axis.
Figure 6 illustrates both pre-amplifier (yellow) and post-amplifier (blue) CCDF curves along with a Gaussian reference shown in grey. It reveals that the two CCDF curves are pretty closely aligned.
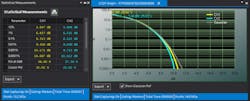
6. CCDF curves allow for a PAPR analysis.
Now, let’s change the attenuation to 0 dB. Figure 7 shows the resulting CCDF curves. The post-amplifier (blue) CCDF curve is dramatically shifted to the left, revealing a significant amount of compression due to lowering the attenuation (i.e., driving the amplifier harder). What this measurement demonstrates is that the RTP5000 sensors are a good tool for PAPR analysis.
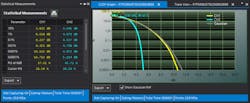
7. The results here reveal compression due to setting the attenuation to 0 dB.
Conclusion
The RTP5000 sensors offer capabilities beyond just simple power measurements, such as PAPR analysis, which was highlighted in this article. And while propagation-delay measurements were not presented, they are also possible thanks to the trigger stability of the RTP5000 sensors. Furthermore, while the software may take a little bit of time to get accustomed to, users should be able grasp it relatively quickly. To sum it all up, it looks like Boonton has a winning product line with the RTP5000 Series.
Reference
1. Empower RF Systems, Using CCDF as a Method of Measuring P1dB and P3dB, Engineering Note.

